YUHINA
  • Home
  • Process
  • Outputs
  • Pricing
English▾
  • English
  • العربية
  • Français
  • Español
  • Deutsch
  • Português
  • Italiano
  • हिन्दी
  • 中文
  • 日本語
  • 한국어
  • Türkçe
  • Русский
  • Bahasa Indonesia
Sign in

How can we help?

Pick what it's about. The answer may already be below.

Something in the app isn't working the way it should.

My verification code hasn't arrived.+

YUHINA sends a 6-digit code to the address you signed up with. Check your spam or promotions folder. If it still isn't there after a few minutes, email support from that address.

Why can't I generate anything?+

You need a verified email first. A new account includes one free chapter with every output, once. After that, generating spends your plan's monthly usage or pay-as-you-go credit, so you need a plan or some credit to keep going.

My PDF gave weak results.+

Each PDF is one chapter, up to 60 pages. A digital PDF with text you can select gives the clearest lessons; blurry, dark, skewed or handwritten scans give weaker ones.

How do I delete my account or my files?+

The app's privacy notice explains how to export or permanently delete your account and everything in it. If something doesn't work, email support.

Still stuck? Email support, from the address on your account:

support@yuhina.ai

Buying for a school or a company? Talk to our enterprise team: enterprise@yuhina.ai

Sample library · Economics

Demand and Supply: video lessons, quiz and flashcards from one textbook chapter

What YUHINA made from one economics chapter: 4 narrated video lessons with slides, 114 questions, 22 flashcards, a mind map and a podcast.

  • 4 lessons
  • 50 slides
  • 114 questions
  • 22 flashcards
  • 36-minute podcast

Generated by YUHINA on 2026-11-10 from a 15-page PDF and shown unedited.

Source: sections 3.1 and 3.2 of chapter 3, “Demand and Supply”, from Principles of Economics (2nd edition) by Steven A. Greenlaw, David Shapiro et al., OpenStax, licensed CC BY 4.0. Principles of Economics. Access the book for free at openstax.org. Changes: YUHINA turned the text into lessons, slides, narration, questions, flashcards, a mind map and a podcast.

Try it with your own chapterSee pricing

The narrated video

The first 60 seconds of lesson 1. The chapter came out as 4 video lessons, about 34 minutes in all.

The first slides of lesson 1

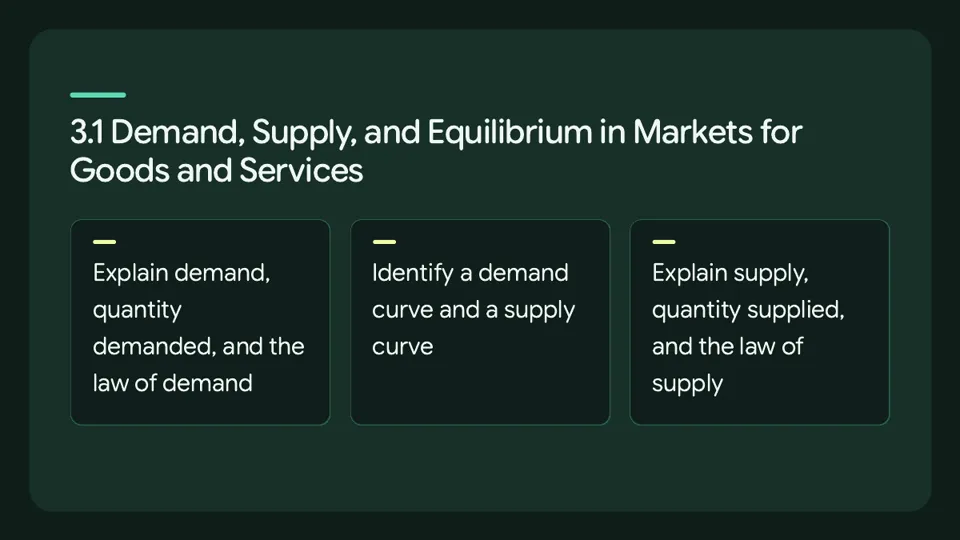
  • Slide 1 of lesson 1
  • Slide 2 of lesson 1
  • Slide 3 of lesson 1

The lessons

YUHINA split the chapter into lessons. Each one has its own summary and quiz, shown below as generated.

Lesson 1: Introduction to Demand and Supply and Market Prices

A demand curve is a graph that shows the relationship between price and quantity demanded, with quantity on the horizontal axis and price per gallon on the vertical axis.

Nearly all demand curves share the fundamental similarity that they slope down from left to right.

Demand curves embody the law of demand: as the price increases, the quantity demanded decreases, and conversely, as the price decreases, the quantity demanded increases.

In economic terminology, demand is not the same as quantity demanded.

When economists talk about demand, they mean the relationship between a range of prices and the quantities demanded at those prices, as illustrated by a demand curve or a demand schedule, whereas when economists talk about quantity demanded, they mean only a certain point on the demand curve, or one quantity on the demand schedule.

In short, demand refers to the curve and quantity demanded refers to the (specific) point on the curve.

law of supply: the positive relationship between price and quantity supplied—a higher price leads to a higher quantity supplied and a lower price leads to a lower quantity supplied

The law of supply assumes that all other variables that affect supply (to be explained in the next module) are held constant.

Demand for Goods and Services — selected points

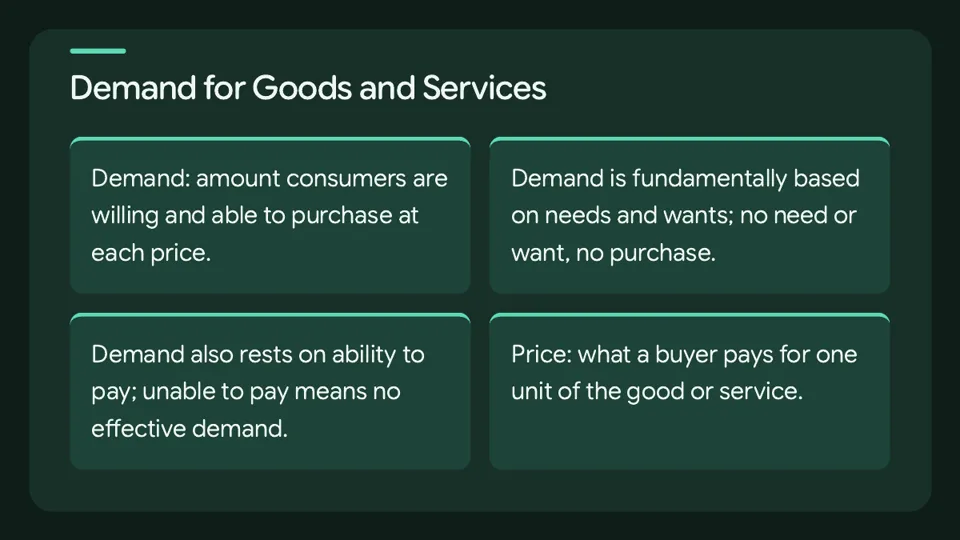
Demand is the amount of some good or service consumers are willing and able to purchase at each price.

Demand is fundamentally based on needs and wants—if you have no need or want for something, you won't buy it—and demand is also based on ability to pay, so if you cannot pay for it, you have no effective demand.

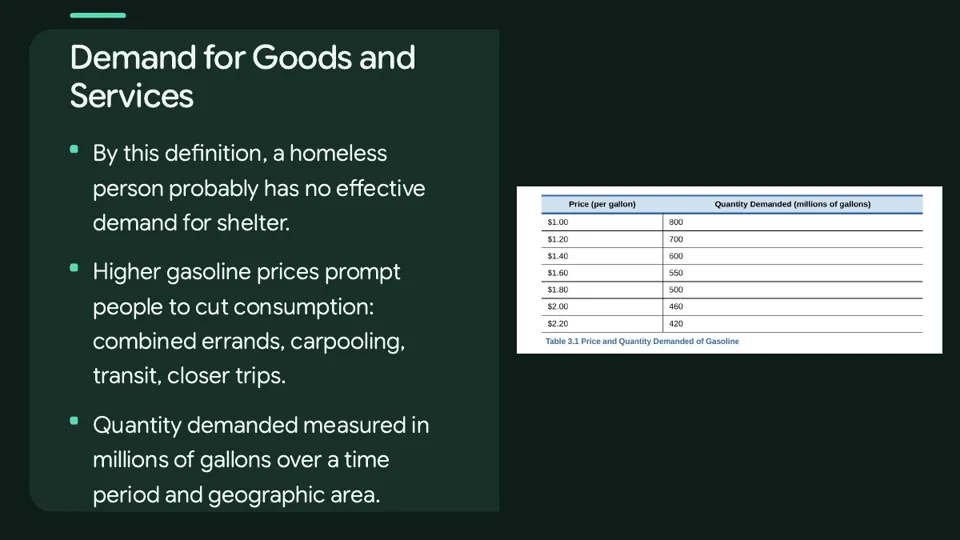
By this definition, a homeless person probably has no effective demand for shelter.

Price is what a buyer pays for a unit of the specific good or service, and quantity demanded is the total number of units that consumers would purchase at that price.

A rise in price of a good or service almost always decreases the quantity demanded of that good or service, and conversely, a fall in price will increase the quantity demanded.

The law of demand is the inverse relationship between price and quantity demanded, and the law of demand assumes that all other variables that affect demand are held constant.

A demand schedule is a table that shows the quantity demanded at each price.

When the price of a gallon of gasoline increases, for example, people look for ways to reduce their consumption by combining several errands, commuting by carpool or mass transit, or taking weekend or vacation trips closer to home.

We measure the quantity demanded in millions of gallons over some time period (for example, per day or per year) and over some geographic area (like a state or a country).

Demand for Goods and Services — selected points

Quantity demanded falls from 800 million gallons at $1.00 to 420 million gallons at $2.20.

Supply of Goods and Services — selected points

When economists talk about supply, they mean the amount of some good or service a producer is willing to supply at each price, and price is what the producer receives for selling one unit of a good or service.

A rise in price almost always leads to an increase in the quantity supplied of that good or service, while a fall in price will decrease the quantity supplied.

Quiz (8 questions)

  1. “the total number of units that consumers would purchase at that price” — which term does this describe?

    • Quantity demanded
    • Law of supply
    • Demand schedule
    • Law of demand
    Show the answer

    Quantity demanded. Quantity demanded is the total number of units that consumers would purchase at a given price. The law of supply is the positive relationship between price and quantity supplied, which concerns producers rather than consumers. A demand schedule is a table showing the quantity demanded at each price, not the quantity itself. The law of demand is the inverse relationship between price and quantity demanded, not the number of units purchased.

  2. Which term is defined as “the inverse relationship between price and quantity demanded”?

    • Law of supply
    • Law of demand
    • Quantity demanded
    • Demand curve
    Show the answer

    Law of demand. The law of demand is the inverse relationship between price and quantity demanded: a rise in price almost always decreases the quantity demanded, and a fall in price increases it. The law of supply is the positive relationship between price and quantity supplied, which concerns producers. Quantity demanded is the total number of units consumers would purchase at a given price, not a relationship. A demand curve is a graph showing the relationship between price and quantity demanded, not the name of the inverse relationship itself.

  3. Which term is defined as “a table that shows the quantity demanded at each price”?

    • Supply
    • Quantity demanded
    • Demand schedule
    • Demand curve
    Show the answer

    Demand schedule. A demand schedule is a table showing the quantity demanded at each price. Supply is the amount of a good or service a producer is willing to supply at each price, which concerns sellers. Quantity demanded is the total number of units consumers would purchase at a given price, not a table. A demand curve is a graph showing the relationship between price and quantity demanded, not a table.

  4. True or false: People drive more in the summer and are also willing to pay more for gas.

    • True
    • False
    Show the answer

    True. It is true that people drive more in the summer and are also willing to pay more for gas, which helps explain why midsummer gasoline prices are typically higher than midwinter prices. The statement is not false, since both claims about summer driving and willingness to pay more are accurate.

  5. True or false: When economists talk about quantity demanded, they mean only a certain point on the demand curve, or one quantity on the demand schedule.

    • True
    • False
    Show the answer

    True. It is true that quantity demanded means only a certain point on the demand curve, or one quantity on the demand schedule, while demand refers to the relationship between a range of prices and the quantities demanded at those prices. The statement is not false, since it correctly distinguishes a single point from the whole curve or schedule.

  6. True or false: Demand curves embody the law of demand: as the price increases, the quantity demanded decreases, and conversely, as the price decreases, the quantity demanded increases.

    • True
    • False
    Show the answer

    True. It is true that demand curves embody the law of demand: as the price increases, the quantity demanded decreases, and conversely, as the price decreases, the quantity demanded increases. The statement is not false, since it accurately describes the downward-sloping relationship shown by demand curves.

  7. Which statement defines “price”?

    • the positive relationship between price and quantity supplied—a higher price leads to a higher quantity supplied and a lower price leads to a lower quantity supplied
    • the amount of some good or service consumers are willing and able to purchase at each price
    • the total number of units that consumers would purchase at that price
    • what a buyer pays for a unit of the specific good or service
    Show the answer

    what a buyer pays for a unit of the specific good or service. Price is what a buyer pays for a unit of the specific good or service. The amount of some good or service consumers are willing and able to purchase at each price is demand, not price. The total number of units that consumers would purchase at that price is quantity demanded, not price. The positive relationship between price and quantity supplied is the law of supply, not price.

  8. Which description fits “price”?

    • a table that shows the quantity demanded at each price
    • the total number of units that consumers would purchase at that price
    • a graph showing the relationship between price and quantity demanded, with quantity on the horizontal axis and price per gallon on the vertical axis
    • what the producer receives for selling one unit of a good or service
    Show the answer

    what the producer receives for selling one unit of a good or service. Price is what the producer receives for selling one unit of a good or service. A table that shows the quantity demanded at each price is a demand schedule, not price. The total number of units that consumers would purchase at that price is quantity demanded, not price. A graph showing the relationship between price and quantity demanded is a demand curve, not price.

Lesson 2: Supply, Quantity Supplied, and the Law of Supply

In economic terminology, supply must be distinguished from quantity supplied.

Supply is the relationship between a range of prices and the quantities supplied at those prices, and this relationship can be illustrated with a supply curve or a supply schedule.

Quantity supplied, by contrast, is only a certain point on the supply curve, or one quantity on the supply schedule.

In short, supply refers to the curve, whereas quantity supplied refers to the specific point on the curve.

The supply schedule and the supply curve are just two different ways of showing the same information.

As price rises, quantity supplied also increases, and vice versa; the upward slope of the supply curve illustrates the law of supply—that a higher price leads to a higher quantity supplied, and vice versa.

The shape of supply curves will vary somewhat according to the product: steeper, flatter, straighter, or curved.

Nearly all supply curves, however, share a basic similarity: they slope up from left to right and illustrate the law of supply: as the price rises, say, from $1.00 per gallon to $2.20 per gallon, the quantity supplied increases from 500 gallons to 720 gallons. Conversely, as the price falls, the quantity supplied decreases.

Equilibrium—Where Demand and Supply Intersect

Because the graphs for demand and supply curves both have price on the vertical axis and quantity on the horizontal axis, the demand curve and supply curve for a particular good or service can appear on the same graph.

Together, demand and supply determine the price and the quantity that will be bought and sold in a market.

Table 3.3 Price, Quantity Demanded, and Quantity Supplied

At the equilibrium price of $1.40, quantity demanded and quantity supplied are both 600 million gallons; at $1.80 quantity supplied (680) exceeds quantity demanded (500), and at $1.20 quantity demanded (700) exceeds quantity supplied (550).

Equilibrium—Where Demand and Supply Intersect

The point where the supply curve (S) and the demand curve (D) cross, designated by point E in Figure 3.4, is called the equilibrium.

The equilibrium price is the only price where the plans of consumers and the plans of producers agree—that is, where the amount of the product consumers want to buy (quantity demanded) is equal to the amount producers want to sell (quantity supplied).

Economists call this common quantity the equilibrium quantity.

At any other price, the quantity demanded does not equal the quantity supplied, so the market is not in equilibrium at that price.

If you had only the demand and supply schedules, and not the graph, you could find the equilibrium by looking for the price level on the tables where the quantity demanded and the quantity supplied are equal.

The word “equilibrium” means “balance,” and if a market is at its equilibrium price and quantity, then it has no reason to move away from that point.

However, if a market is not at equilibrium, then economic pressures arise to move the market toward the equilibrium price and the equilibrium quantity.

In fact, at any above-equilibrium price, the quantity supplied exceeds the quantity demanded, which is called an excess supply or a surplus; with a surplus, gasoline accumulates at gas stations, in tanker trucks, in pipelines, and at oil refineries.

In this situation, some producers and sellers will want to cut prices, because it is better to sell at a lower price than not to sell at all; once some sellers start cutting prices, others will follow to avoid losing sales, and these price reductions in turn will stimulate a higher quantity demanded.

Therefore, if the price is above the equilibrium level, incentives built into the structure of demand and supply will create pressures for the price to fall toward the equilibrium.

When the price is below equilibrium, there is excess demand, or a shortage—that is, at the given price the quantity demanded, which has been stimulated by the lower price, now exceeds the quantity supplied, which had been depressed by the lower price.

Oil companies and gas stations recognize that they have an opportunity to make higher profits by selling what gasoline they have at a higher price, and as a result, the price rises toward the equilibrium level.

Quiz (6 questions)

  1. True or false: The supply schedule and the supply curve are just two different ways of showing the same information.

    • True
    • False
    Show the answer

    True. A supply schedule is a table showing quantity supplied at different prices, and a supply curve is a graph of that same information, so they present the same relationship in two forms. They are not two different relationships; the table and the graph convey identical price and quantity data.

  2. True or false: The upward slope of the supply curve illustrates the law of supply—that a higher price leads to a higher quantity supplied, and vice versa.

    • True
    • False
    Show the answer

    True. The law of supply states that as price rises, quantity supplied increases, and as price falls, quantity supplied decreases, which is illustrated by the upward slope of the supply curve. Nearly all supply curves share this upward slope, though their shapes vary somewhat according to the product.

  3. True or false: As price rises, quantity supplied also increases, and vice versa.

    • True
    • False
    Show the answer

    True. The law of supply says that a higher price leads to a higher quantity supplied, and a lower price leads to a lower quantity supplied. This is shown by the upward-sloping supply curve, and nearly all supply curves share this upward slope, though their shapes vary somewhat according to the product.

  4. True or false: At any below-equilibrium price, the quantity supplied exceeds the quantity demanded; this is called an excess supply or a surplus.

    • True
    • False
    Show the answer

    False. At a below-equilibrium price, quantity demanded exceeds quantity supplied, which is called excess demand or a shortage, not excess supply or a surplus. A surplus occurs at an above-equilibrium price, where quantity supplied exceeds quantity demanded.

  5. True or false: If you had only the demand and supply schedules, and not the graph, you could find the equilibrium by looking for the price level on the tables where the quantity demanded and the quantity supplied are equal.

    • True
    • False
    Show the answer

    True. Equilibrium is the price where quantity demanded equals quantity supplied, so with only the schedules one can find it by locating the price level at which the two quantities are equal. The equilibrium quantity is that common amount, and the schedules contain the same information as the graph.

  6. True or false: Nearly all supply curves share a basic similarity: they slope up from left to right and illustrate the law of supply.

    • True
    • False
    Show the answer

    True. Nearly all supply curves slope up from left to right, illustrating the law of supply that a higher price leads to a higher quantity supplied. Their shapes can be steeper, flatter, straighter, or curved depending on the product, but the upward slope is a basic similarity.

Lesson 3: Factors That Shift Demand Curves

Willingness to purchase reflects a desire grounded in what economists call tastes and preferences, while ability to purchase reflects the importance of income.

The prices of related goods can also affect demand, and the size or composition of the population can affect demand as well.

A family with more children has a greater demand for clothing, and a family with more driving-age children has a greater demand for car insurance but less for diapers and baby formula.

A normal good is a product whose demand rises when income rises and falls when income falls, whereas an inferior good is a product whose demand falls when income rises and rises when income falls.

A change in any one of the underlying factors that determine what quantity people are willing to buy at a given price causes a shift in demand, and graphically the new demand curve lies to the right for an increase or to the left for a decrease of the original demand curve.

A society with relatively more children, such as the United States in the 1960s, has greater demand for goods and services like tricycles and day care facilities, while a society with relatively more elderly persons, as the United States is projected to have by 2030, has a higher demand for nursing homes and hearing aids.

A substitute is a good or service that can be used in place of another good or service, and a lower price for a substitute decreases demand for the other product.

If the price of golf clubs rises, the quantity demanded of golf clubs falls because of the law of demand, and demand for a complement good like golf balls decreases too.

Figure 3.9 summarizes six factors that can shift demand curves.

The Ceteris Paribus Assumption

Economists call the assumption that other things are held equal ceteris paribus, a Latin phrase meaning “other things being equal.”

A demand curve or a supply curve is a relationship between two, and only two, variables when all other variables are kept constant.

When does ceteris paribus apply?

For example, an increase in price reduces the amount consumers will buy assuming income and anything else that affects demand is unchanged, and a decrease in income reduces the amount consumers can afford to buy assuming price and anything else that affects demand is unchanged.

The amount consumers buy falls for two reasons: first because of the higher price and second because of the lower income.

How Does Income Affect Demand?

A product whose demand rises when income rises, and vice versa, is called a normal good, while a product whose demand falls when income rises, and vice versa, is called an inferior good.

When a demand curve shifts, the quantity demanded by every individual buyer does not change by the same amount; instead, a shift in a demand curve captures a pattern for the market as a whole.

Changing Tastes or Preferences

From 1980 to 2014, the per-person consumption of chicken by Americans rose from 48 pounds per year to 85 pounds per year, and consumption of beef fell from 77 pounds per year to 54 pounds per year, according to the U.S. Department of Agriculture (USDA).

Changes in the Composition of the Population

Changes in the size of the population can affect the demand for housing and many other goods.

Changes in Expectations about Future Prices or Other Factors that Affect Demand

If people hear that a hurricane is coming, they may rush to the store to buy flashlight batteries and bottled water, and if people learn that the price of a good like coffee is likely to rise in the future, they may head for the store to stock up on coffee now.

A shift in demand happens when a change in some economic factor other than price causes a different quantity to be demanded at every price.

Shift in Demand

A shift in demand means that at any price, and at every price, the quantity demanded will be different than it was before.

Step 3 is to shift the curve through the new point, which shows that an increase in income causes an upward, or rightward, shift in the demand curve, so that at any price the quantities demanded will be higher, as Figure 3.8 illustrates.

Step 1. Draw the graph of a demand curve for a normal good like pizza. Pick a price (like P_0). Identify the corresponding Q_0.

Step 2. Suppose income increases. As a result of the change, are consumers going to buy more or less pizza? The answer is more. Draw a dotted horizontal line from the chosen price, through the original quantity demanded, to the new point with the new Q_1. Draw a dotted vertical line down to the horizontal axis and label the new Q_1.

Summing Up Factors That Change Demand

A change in the price of the good or service itself is not listed among the factors that can shift a demand curve, because such a change causes a movement along a specific demand curve and typically leads to some change in the quantity demanded but does not shift the demand curve.

When a demand curve shifts, it will then intersect with a given supply curve at a different equilibrium price and quantity.

How Production Costs Affect Supply — selected points

A shift in supply means that the quantity supplied changes at every price, just as a shift in demand means that the quantity demanded changes at every price.

Firms are motivated by profits, which are the difference between revenues and costs, and firms produce goods and services using combinations of labor, materials, and machinery, called inputs or factors of production.

If a firm faces higher costs of production, then it will earn lower profits at any given selling price for its products.

As a result, a higher cost of production typically causes a firm to supply a smaller quantity at any given price, and the supply curve shifts to the left.

Quiz (7 questions)

  1. Which term is defined as “a Latin phrase meaning "other things being equal"”?

    • Ceteris paribus
    • Supply curve
    • Normal good
    • Substitute
    Show the answer

    Ceteris paribus. ceteris paribus: a Latin phrase meaning "other things being equal"

  2. Which term matches this description: “a product whose demand rises when income rises, and vice versa”?

    • Supply curve
    • Normal good
    • Ceteris paribus
    • Inferior good
    Show the answer

    Normal good. A normal good is defined as a product whose demand rises when income rises, and vice versa. A supply curve shows the relationship between price and quantity supplied, not a good's response to income. Ceteris paribus is the assumption that other things are equal, not a type of good. An inferior good is one whose demand falls when income rises, the opposite of the description.

  3. “a product whose demand falls when income rises, and vice versa” — which term does this describe?

    • Ceteris paribus
    • Demand
    • Inferior good
    • Shift in supply
    Show the answer

    Inferior good. An inferior good is a product whose demand falls when income rises, and vice versa. Ceteris paribus is the assumption that other factors are held constant, not a good's income response. Demand is the amount consumers are willing and able to buy at each price, not the term for this income relationship. A shift in supply is a change in quantity supplied at every price, not a good whose demand falls with income.

  4. True or false: An income increase can cause a shift in demand.

    • True
    • False
    Show the answer

    True. An increase in income can shift the demand curve for a normal good to the right, so that at any price the quantity demanded is higher. This is true because income is one of the factors other than price that can cause demand to change at every price.

  5. True or false: When costs of production fall, a firm tends to supply a larger quantity at any given price, shown by the supply curve shifting to the right.

    • True
    • False
    Show the answer

    True. When production costs fall, a firm can earn more profit at any given price and is motivated to supply a larger quantity, which is shown by the supply curve shifting to the right. This is true because lower costs increase the quantity supplied at every price.

  6. True or false: The fewer driving-age children a family has, the greater their demand for car insurance and the less for diapers and baby formula.

    • True
    • False
    Show the answer

    False. The statement is false because it reverses the relationship: the more driving-age children a family has, the greater their demand for car insurance and the less for diapers and baby formula. A family with fewer driving-age children would have less demand for car insurance and more for diapers and baby formula.

  7. Which description fits “substitute”?

    • at any price (and at every price), the quantity demanded will be different than it was before
    • the difference between revenues and costs
    • a good or service that we can use in place of another good or service
    • the amount of some product a consumer is willing and able to purchase at each price
    Show the answer

    a good or service that we can use in place of another good or service. A substitute is a good or service that can be used in place of another good or service. The difference between revenues and costs defines profits, not a substitute. A change in quantity demanded at every price describes a shift in demand, not a substitute. The amount a consumer is willing and able to purchase at each price defines demand, not a substitute.

Lesson 4: Factors That Shift Supply Curves

A drought reduces the supply of agricultural products, meaning that at any given price a lower quantity is supplied.

Conversely, especially good weather shifts the supply curve to the right, and when a firm discovers a new technology that allows it to produce at a lower cost, the supply curve also shifts to the right.

Shifts in Supply: A Car Example

Decreased supply means that at every given price the quantity supplied is lower, so the supply curve shifts to the left from S_0 to S_1, whereas increased supply means that at every given price the quantity supplied is higher, so the supply curve shifts to the right from S_0 to S_2.

At a price of $20,000, the quantity supplied decreases from 18 million on the original supply curve S_0 to 16.5 million on the supply curve S_1, which is labeled as point L.

At a price of $20,000, the quantity supplied increases from 18 million on the original supply curve (S_0) to 19.8 million on the supply curve S_2, which is labeled M.

Price and Shifts in Supply: A Car Example

At $16,000, the quantities are 10.5 million on S_1, 12.0 million on S_0, and 13.2 million on S_2; at $26,000, the quantities are 20.5 million on S_1, 22.0 million on S_0, and 24.2 million on S_2.

Other Factors That Affect Supply — selected points

By the early 1990s, more than two-thirds of the wheat and rice in low-income countries around the world used these Green Revolution seeds, and the harvest was twice as high per acre.

For example, the U.S. government imposes a tax on alcoholic beverages that collects about $8 billion per year from producers.

Businesses treat taxes as costs, and higher costs decrease supply for the reasons discussed above.

Other examples of policy that can affect cost are the wide array of government regulations that require firms to spend money to provide a cleaner environment or a safer workplace, and complying with regulations increases costs.

From the firm's perspective, taxes or regulations are an additional cost of production that shifts supply to the left, leading the firm to produce a lower quantity at every given price, whereas a technological improvement that reduces costs of production shifts supply to the right, so that a greater quantity is produced at any given price.

Government policies can affect the cost of production and the supply curve through taxes, regulations, and subsidies; a subsidy occurs when the government pays a firm directly or reduces the firm's taxes if the firm carries out certain actions, and government subsidies reduce the cost of production and increase supply at every given price, shifting supply to the right.

Shift in Supply — selected points

A supply curve shows the minimum price a firm will accept to produce a given quantity of output.

Step 3. Now, suppose that the cost of production increases. Perhaps cheese has become more expensive by $0.75 per pizza. If that is true, the firm will want to raise its price by the amount of the increase in cost ($0.75).

Step 4. Shift the supply curve through this point. You will see that an increase in cost causes an upward (or a leftward) shift of the supply curve so that at any price, the quantities supplied will be smaller

Quiz (6 questions)

  1. True or false: A drought decreases the supply of agricultural products, so at any given price a lower quantity will be supplied.

    • True
    • False
    Show the answer

    True. A drought raises the cost of producing agricultural products, so at any given price a lower quantity is supplied and the supply curve shifts to the left. The statement is therefore true, not false.

  2. True or false: A technological improvement that reduces costs of production shifts supply to the right, so a greater quantity is produced at any given price.

    • True
    • False
    Show the answer

    True. A technological improvement that lowers production costs lets a greater quantity be produced at any given price, so supply shifts to the right. The statement is therefore true, not false.

  3. True or false: When a firm discovers a new technology that allows it to produce at a lower cost, the supply curve shifts to the right.

    • True
    • False
    Show the answer

    True. When a firm discovers a new technology that allows it to produce at a lower cost, it can supply a greater quantity at any given price, so the supply curve shifts to the right. The statement is therefore true, not false.

  4. True or false: Government policies can affect the cost of production and the supply curve through taxes, regulations, and subsidies.

    • True
    • False
    Show the answer

    True. Government policies affect the cost of production and the supply curve through taxes, regulations, and subsidies. Taxes and regulations are additional costs that shift supply to the left, while subsidies reduce costs and shift supply to the right. The statement is therefore true, not false.

  5. True or false: Government subsidies increase the cost of production and reduce supply at every given price, shifting supply to the left.

    • True
    • False
    Show the answer

    False. Government subsidies reduce the cost of production and increase supply at every given price, shifting supply to the right. The statement says the opposite, so it is false.

  6. True or false: Businesses treat taxes as costs, and higher costs decrease supply.

    • True
    • False
    Show the answer

    True. Businesses treat taxes as costs, and higher costs decrease supply, shifting the supply curve to the left. The statement is therefore true, not false.

Flashcards

  • demand

    the amount of some good or service consumers are willing and able to purchase at each price

  • price

    what a buyer pays for a unit of the specific good or service

  • quantity demanded

    the total number of units that consumers would purchase at that price

  • law of demand

    the inverse relationship between price and quantity demanded

  • demand schedule

    a table that shows the quantity demanded at each price

  • demand curve

    a graph showing the relationship between price and quantity demanded, with quantity on the horizontal axis and price per gallon on the vertical axis

  • supply

    the amount of some good or service a producer is willing to supply at each price

  • law of supply

    the positive relationship between price and quantity supplied—a higher price leads to a higher quantity supplied and a lower price leads to a lower quantity supplied

  • quantity supplied

    only a certain point on the supply curve, or one quantity on the supply schedule

  • equilibrium

    the point where the supply curve (S) and the demand curve (D) cross, designated by point E in Figure 3.4

  • equilibrium price

    the only price where the plans of consumers and the plans of producers agree—that is, where the amount of the product consumers want to buy (quantity demanded) is equal to the amount producers want to sell (quantity supplied)

  • equilibrium quantity

    Economists call this common quantity the equilibrium quantity.

  • ceteris paribus

    a Latin phrase meaning "other things being equal"

  • normal good

    a product whose demand rises when income rises, and vice versa

  • inferior good

    a product whose demand falls when income rises, and vice versa

  • substitute

    a good or service that we can use in place of another good or service

  • shift in demand

    at any price (and at every price), the quantity demanded will be different than it was before

  • supply curve

    shows how quantity supplied will change as the price rises and falls, assuming ceteris paribus so that no other economically relevant factors are changing

  • shift in supply

    a change in the quantity supplied at every price

  • profits

    the difference between revenues and costs

  • inputs or factors of production

    combinations of labor, materials, and machinery used by a firm to produce goods and services

  • subsidy

    A subsidy occurs when the government pays a firm directly or reduces the firm's taxes if the firm carries out certain actions.

Mind map

Chapter 3 | Demand and Supply

  • Price Ceilings and Price Floors

  • 3.1 | Demand, Supply, and Equilibrium in Markets for Goods and Services

    • Demand for Goods and Services
      • demand
      • needs and wants
      • ability to pay
      • price
      • quantity demanded
      • law of demand
      • demand schedule
      • demand curve
    • Supply of Goods and Services
      • supply
      • quantity supplied
      • law of supply
      • supply schedule
      • supply curve
    • Equilibrium—Where Demand and Supply Intersect
      • equilibrium
      • equilibrium price
      • equilibrium quantity
      • excess supply
      • surplus
      • excess demand
      • shortage

The podcast

The first 90 seconds of a 36-minute episode about the whole chapter. How it opens:
host
Welcome to the episode. I am glad you are joining us. Today we begin a conversation about how markets for goods and services work, starting with demand, supply, and the ideas that connect them.
guest
Thank you for having me. It is a pleasure to be here. We will build up the basic vocabulary economists use to describe how buyers and sellers behave in a market.
host
Let us start with demand. What does the term actually mean in economics?
guest
Economists use demand to refer to the amount of some good or service that consumers are willing and able to purchase at each price. Both parts matter. Demand is fundamentally based on needs and wants, because if you have no need or want for something, you will not buy it. It is also based on the ability to pay, since if you cannot pay for something, you have no effective demand.
host
So willingness alone is not enough. Could you give an imagined example to make that distinction concrete?
guest
Picture a person who admires a luxury car but cannot afford it. That person has the want but not the ability to pay, so the demand is not effective. By this definition, a homeless person probably has no effective demand for shelter. And to be precise about price, it is simply what a buyer pays for a unit of the specific good or service.

Source: sections 3.1 and 3.2 of chapter 3, “Demand and Supply”, from Principles of Economics (2nd edition) by Steven A. Greenlaw, David Shapiro et al., OpenStax, licensed CC BY 4.0. Principles of Economics. Access the book for free at openstax.org. Changes: YUHINA turned the text into lessons, slides, narration, questions, flashcards, a mind map and a podcast.

Try it with your own chapterSee pricing

More samples

  • Psychology

    Memory

    3 lessons · 57 slides · 124 questions · 26 flashcards · 25-minute podcast

  • Biology

    Cell Structure

    4 lessons · 55 slides · 115 questions · 32 flashcards · 37-minute podcast

  • Chemistry

    Atoms, Molecules, and Ions

    4 lessons · 54 slides · 112 questions · 17 flashcards · 37-minute podcast

  • Anatomy and Physiology

    Heart Anatomy

    4 lessons · 60 slides · 110 questions · 32 flashcards · 43-minute podcast

  • Astronomy

    The Sun

    4 lessons · 58 slides · 112 questions · 22 flashcards · 43-minute podcast

  • Physics

    Forces and Newton’s Laws of Motion

    4 lessons · 63 slides · 112 questions · 18 flashcards · 44-minute podcast

  • American Government

    The Constitution and Its Origins

    3 lessons · 82 slides · 104 questions · 15 flashcards · 55-minute podcast

  • Sociology

    Culture

    2 lessons · 86 slides · 89 questions · 20 flashcards · 50-minute podcast

All samples
YUHINA

One chapter in. A whole course out.

YUHINA generates the teaching content around your source material — narrated video, question banks, slide decks, podcasts, mind maps and flash cards, all from the same text.

Questions?

Support
support@yuhina.ai
General inquiries
hello@yuhina.ai
Enterprise
enterprise@yuhina.ai

Explore

  • Home
  • Process
  • Outputs
  • Pricing
  • Compare
  • Samples
  • Documentation
  • Contact
  • Get started
  • Sign in
  • Enterprise
  • YouTube
  • X

What it generates

  • PDF to video
  • PDF to quiz
  • PDF to flash cards
  • PDF to podcast
  • PDF to mind map
  • PDF summary

Who it's for

  • Teachers
  • Students
  • Trainers
  • Tutoring centres

Legal

  • Terms
  • Privacy
  • Refunds
  • AI disclosure
  • Accessibility
  • Subprocessors
  • Security
  • This site's privacy notice

© 2026 YUHINA. All rights reserved.

Back to top

YUHINA